
In the digital age, improving user experience (UX) is important for businesses in many ways. It is especially important in terms of providing a competitive advantage and increasing customer loyalty. Users are constantly raising their expectations of products and services, and companies must adopt innovative and user-oriented approaches to meet these expectations. In this process, careful analysis of user feedback and effective use of digital tools play a critical role in improving user experience. In particular, the best free weather API services that provide global weather data have begun to stand out in this area. These services are also known as Python weather API services because they are frequently used with Python projects.
Global weather data stands out as an innovative way to improve user experience. Accurate and instant integration of weather data makes users’ daily lives easier and supports decision-making processes. For example, e-commerce sites can make product recommendations or optimize delivery processes by taking into account the weather conditions in the region where the users are located. Travel applications can use weather data to suggest the most suitable travel timing and routes to users. Such applications exceed users’ expectations, increase their satisfaction, and strengthen businesses’ user experience strategies. Due to the multiple advantages of using this data, in this article, we will take a look at how to use the best free weather API and visualize the data. But first, let’s get to know the most eye-catching weather API that stands out in the market.
Table of Contents
Best Python Weather API for Retrieving Weather Data: Weathersatck API

Weatherstack API stands out as one of the best weather APIs in the market with its comprehensive and reliable weather data. First of all, this API meets the users’ instant needs with current weather data collected from cities around the world. Especially e-commerce sites, travel applications, and other digital platforms can provide their users with instant information about the weather conditions in their region thanks to the weatherstack Python weather API. Thus, they can significantly improve the user experience. Moreover, the data accuracy and reliability of the API help users make the right decisions.
The weatherstack API not only provides instant weather data but also offers detailed weather forecasts. These forecasts allow businesses and developers to easily learn about future weather conditions. Such forecasts are of great importance, especially in planning and logistics processes. Businesses can optimize their operations and provide better service to their users by using weather forecasts. For example, a weather app developer can increase the value of his application by providing users with detailed and reliable weather forecasts thanks to the weatherstack API.
Another advantage of the weatherstack API is that users can easily access weather data. Thanks to its user-friendly interface and comprehensive documentation, developers can integrate the API quickly and effectively. This enables faster implementation of projects and uninterrupted access to weather data for users. In addition, the high performance and scalable structure of the API allows it to work flexibly to meet the needs of businesses of different sizes.
Finally, weatherstack API provides its users with not only current and forecasted weather data but also historical data. This feature allows users to analyze past weather data. Thus, they have the chance to evaluate trends and possibilities.
Explore how to collect historical weather data using the weatherstack API!
Visualize Global Weather Data in Python with Weatherstack API
Data visualization is an effective way to present complex data in a more understandable and user-friendly way. In modern data analysis, visual representations of data help both technical and non-technical users to quickly access and understand information. Python has rich libraries for data visualization, and thanks to these libraries, it is possible to create various graphs, charts, and interactive visuals.
Discover how to create a simple weather app with HTML, CSS, and JS!
The libraries we will use in the weather data visualization application provide great convenience in data extraction and visualization processes, allowing users to effectively present instant weather information. So, let’s first get to know these libraries and then develop step by step our application.
Application Libraries
The ‘Request’, ‘Matplotlib’, and ‘Pillow’ libraries that we will use in the application make it possible to perform data extraction and visualization processes smoothly and effectively. The definitions of these libraries are as follows:
Requests
It is a popular library used to make HTTP requests in Python. ‘Requests’, which have a simple and easy-to-use interface, make it very easy to extract data by making GET and POST requests to APIs. In this application, this library is used to get weather data by making a request to weatherstack API.
Matplotlib
‘Matplotlib’ is one of the most widely used libraries for data visualization in Python. It supports various types of graphs and offers a flexible structure. In this application, it is used to visualize weather data as bar graphs. Thanks to ‘Matplotlib’, the data is transformed into visuals that users can easily understand.
Pillow
‘Pillow’ is a powerful library used for image processing in Python. It allows you to easily open, edit, and save images. In this application, this library is used for visualization by processing the weather icon retrieved from the API with ‘Matplotlib’. ‘Pillow’ ensures that images are processed correctly and effectively.
Signing up for Weatherstack API
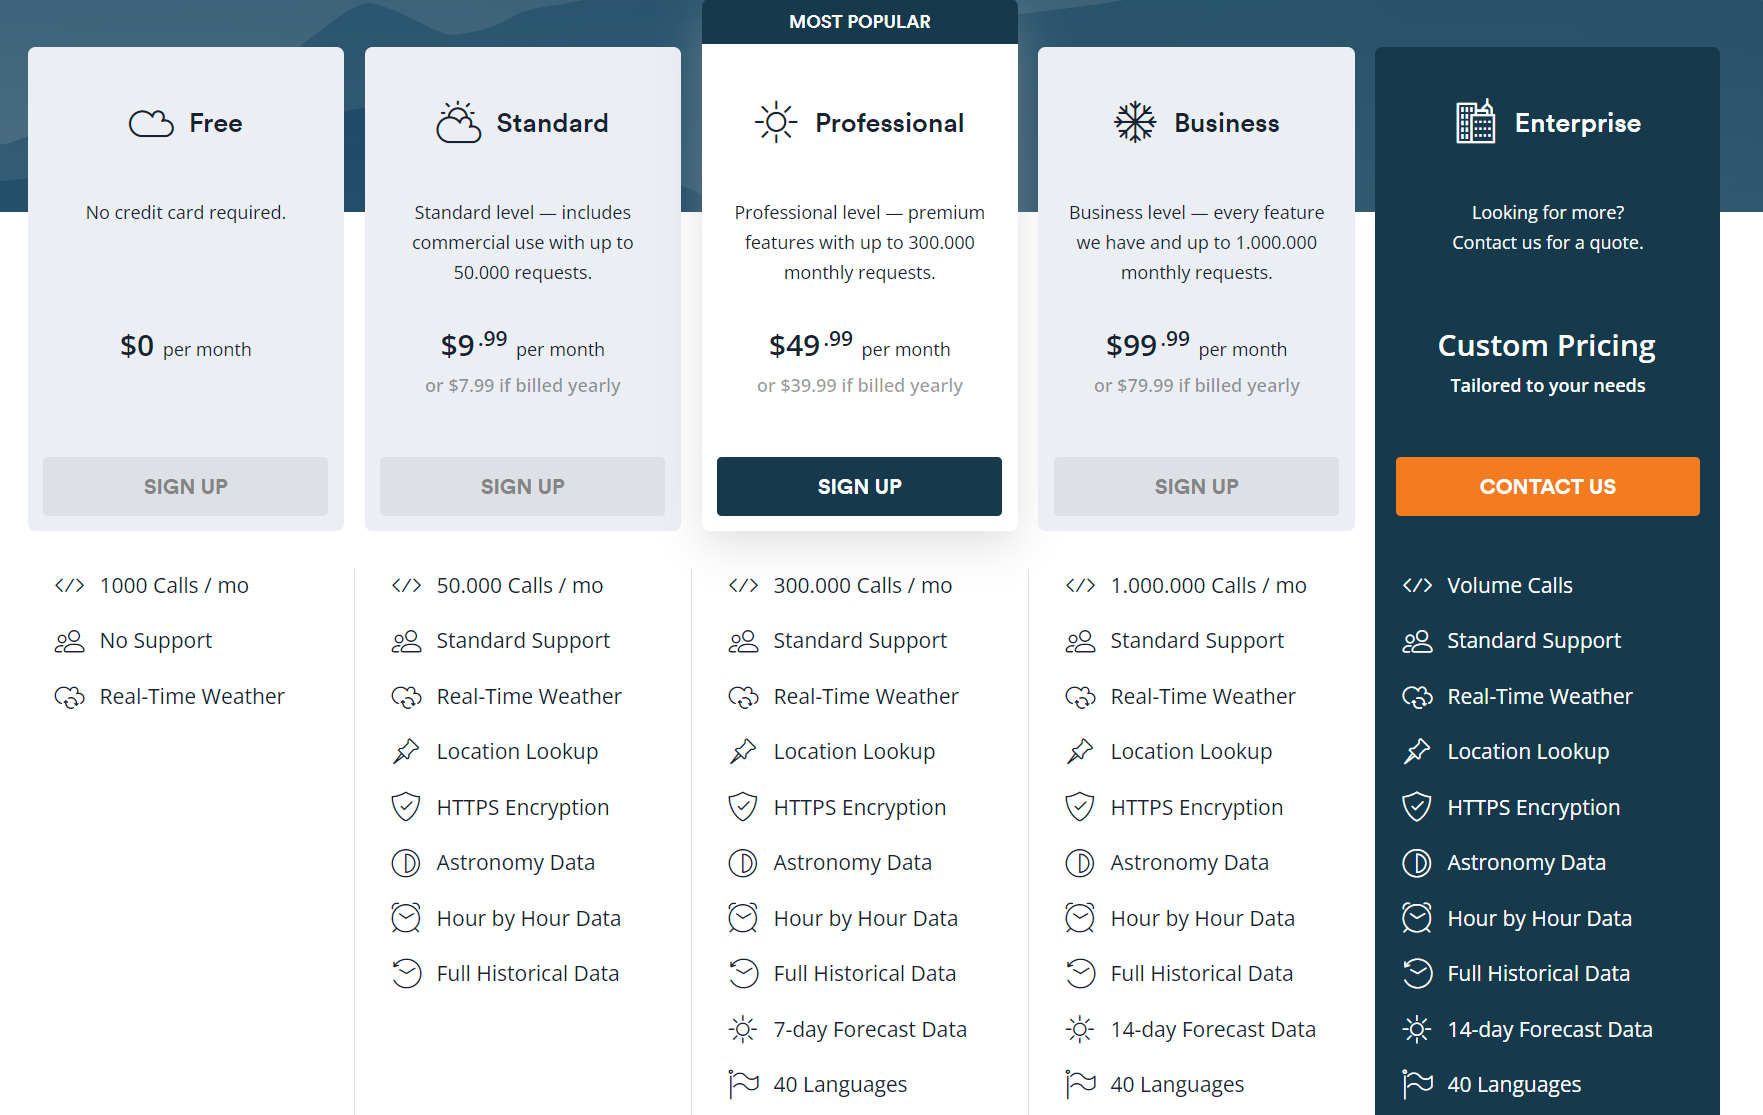
The first step to start developing the application is to register with weatherstack and obtain an API key. Weatherstack takes an innovative approach by offering us one free and three paid plans. The free plan it offers is limited to 250 API calls per month. Paid plans start at $9.99 for 50,000 API calls per month and go up to $99.99 per month for 1,000,000 API calls per month.
In this section, let’s sign up for the free plan offered by weatherstack in just one step and get an API key. We can view the API key we get and detailed API usage on the ‘Dashboard’ page.
Installing the Necessary Libraries
After obtaining an API key, we can now install the necessary libraries and start developing the application. To do this, let’s run the command below in a terminal and wait for the installation to complete.
pip install requests matplotlib pillowCode
In this step, we can now start developing our weather data Python visualizer. To do this, let’s open a file named ‘weather-data-visualization.py’ in the file path where we started developing the application and start developing the application.
Importing Libraries
import requests
import matplotlib.pyplot as plt
from PIL import Image
from io import BytesIO
First, we import the libraries we will use in our Python application. The requests library is used to make HTTP requests, matplotlib.pyplot is used for visualization, and the PIL (Pillow) library is used for image processing. BytesIO from the io module is included to process data in byte format for use with Pillow.
API Endpoint and Access Key
url = "http://api.weatherstack.com/current"
access_key = "FREE_ACCESS_KEY"
query = "Amsterdam"
The API endpoint and access key are required to pull data from the weatherstack API. Here, the URL of the weatherstack API and our API access key are defined. Additionally, a query parameter is specified to pull weather data for the city of Amsterdam.
Request to API
params = {
    'access_key': access_key,
    'query': query
}
response = requests.get(url, params=params)
data = response.json()
In this section, a GET request is sent to the weatherstack API. The ‘params’ variable contains the access key and the query parameter. The ‘requests.get’ function sends a request to the specified URL, parses the JSON data returned from the API with ‘response.json()’, and assigns it to the data variable.
Parsing Data from API
current_weather = data['current']
location = data['location']

temperature = current_weather['temperature']
wind_speed = current_weather['wind_speed']
humidity = current_weather['humidity']
pressure = current_weather['pressure']
cloudcover = current_weather['cloudcover']
weather_description = current_weather['weather_descriptions'][0]
weather_icon = current_weather['weather_icons'][0]
In this section, we parse the data coming from the API and assign the relevant weather information to variables. The ‘current_weather’ variable contains the current weather information, and the location variable contains the location information. We assigned data such as temperature, wind speed, humidity, pressure, cloud cover, and weather description to the relevant variables.
Printing Data
print(f"Location: {location['name']}, {location['country']}")
print(f"Temperature: {temperature}°C")
print(f"Wind Speed: {wind_speed} km/h")
print(f"Humidity: {humidity}%")
print(f"Pressure: {pressure} hPa")
print(f"Cloud Cover: {cloudcover}%")
print(f"Weather: {weather_description}")
We print the data we parse to the console to provide information to the user. We will print information such as location, temperature, wind speed, humidity, pressure, cloud cover, and weather description to the screen in a readable format.
Data Visualization
fig, ax = plt.subplots(figsize=(10, 6))
ax.barh('Temperature', temperature, color='skyblue')
ax.barh('Wind Speed', wind_speed, color='lightgreen')
ax.barh('Humidity', humidity, color='lightcoral')
ax.barh('Pressure', pressure, color='lightsalmon')
ax.barh('Cloud Cover', cloudcover, color='lightblue')
plt.title(f"Current Weather in {location['name']}, {location['country']}")
plt.xlabel('Values')
plt.ylabel('Metrics')
plt.text(50, -1.5, f"Weather: {weather_description}", fontsize=12, ha='center')
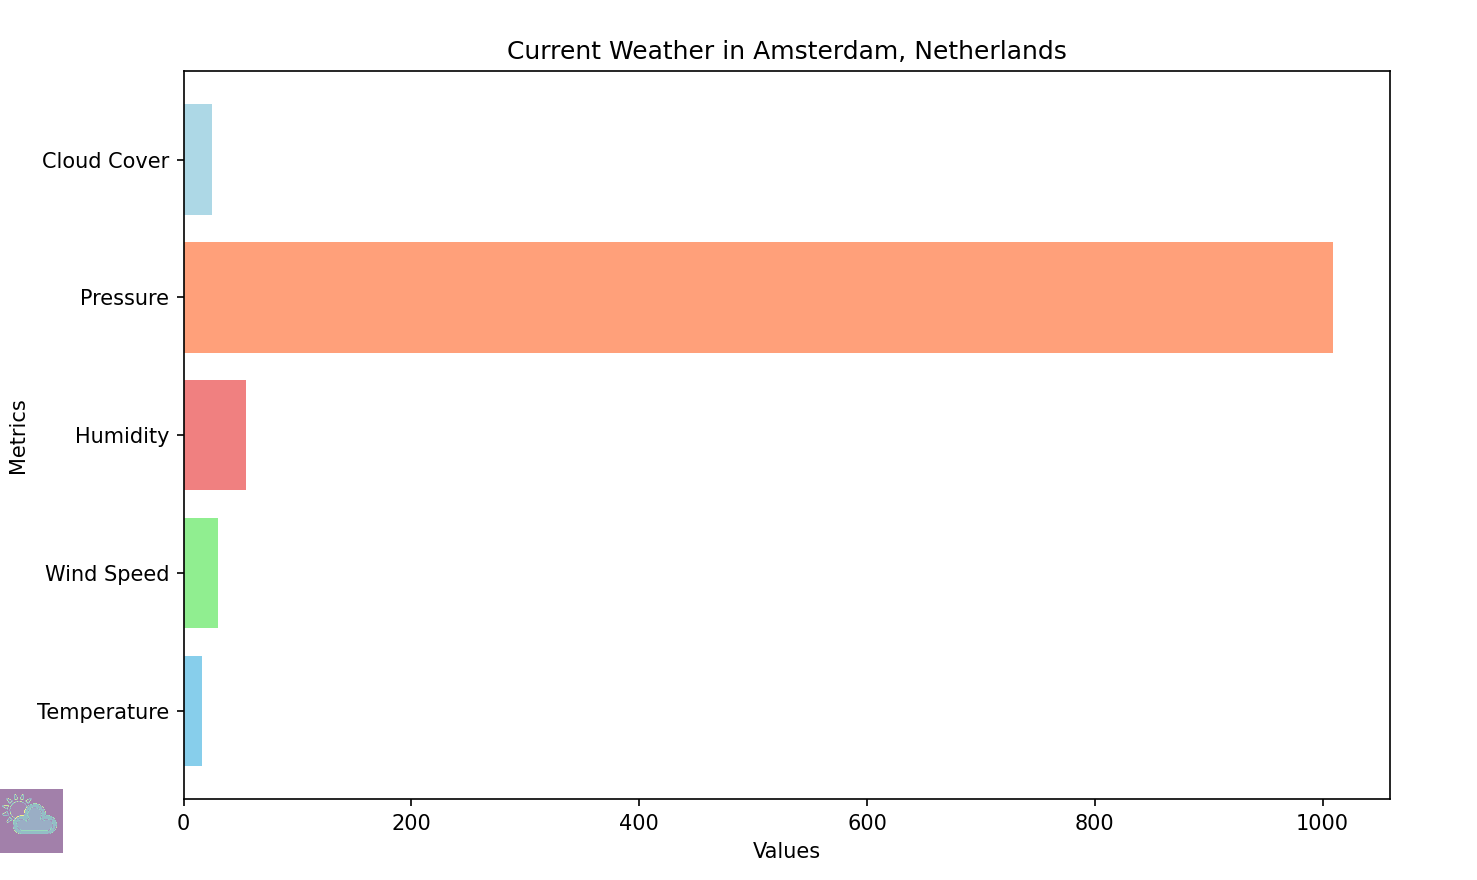
plt.text(50, -2, f"Observation Time: {current_weather['observation_time']}", fontsize=10, ha='center')In this section, we visualize weather data using ‘Matplotlib’. We define a graphic area by creating ‘fig’ and ‘ax’ objects. Weather data is visualized as bar charts. We also add the title of the chart, axis labels, and weather descriptions.
Weather Icon and Visualization
response_icon = requests.get(weather_icon)
img = Image.open(BytesIO(response_icon.content))
plt.figimage(img, 10, 50, zorder=3, alpha=0.5)

plt.show()
Finally, we will download and visualize the weather icon. We download the image from the icon URL with ‘requests.get’ and open it with ‘Image.open’ using ‘Pillow’. With the ‘plt.figimage’ function, the image is placed in a suitable position on the graph and the graph is displayed. In this section, we ensure that the weather data becomes visually richer and more understandable.
Test
To test the application, let’s put our own API key in the ‘access_key’ field and run the application with the following command:
python weather-data-visualization.pyAfter running the application, the chart we get is as follows:
Wrapping up
To sum up, visualizing global weather data is extremely valuable for understanding and analyzing weather conditions on a global scale. Such visualizations are an important tool for meteorologists, environmental scientists, agriculturalists, and general users. Platforms that provide weather data, such as weatherstack Python weather API, make it easy to create these visualizations by providing users with access to real-time and up-to-date information. The wide range of data provided by the API and easy integration features allow users to effectively use weather data in their various applications.
Quickly register for the best free weather API to start data visualization with Python!
FAQs
Q: Can I access real-time weather data using the weatherstack Python weather API?
A: Yes, weatherstack API provides instant and up-to-date weather data for various locations around the world. This API helps users manage their daily lives by allowing them to track the current weather conditions in any geographic area with accuracy.
Q: Does weatherstack offer historical weather data?
A: Yes, weatherstack API allows users to access weather data from past dates. With this feature, users can examine the weather conditions on a specific date and perform historical analysis.
Q: How do you get weather data in Python?
A: There are several ways to access weather data in Python. One of the most common ways is to pull data through weather APIs. For example, third-party API providers like weatherstack provide weather data in JSON format using HTTP requests.
Q: Can I retrieve weather data for specific locations or coordinates?
A: Absolutely, you can retrieve weather data for specific locations or provide geographical coordinates to get accurate weather information.
Q: Is it possible to customize the weather data parameters I retrieve?
A: Yes, weatherstack API offers customizable parameters, allowing you to specify the weather variables you need for your analysis and visualization.
