
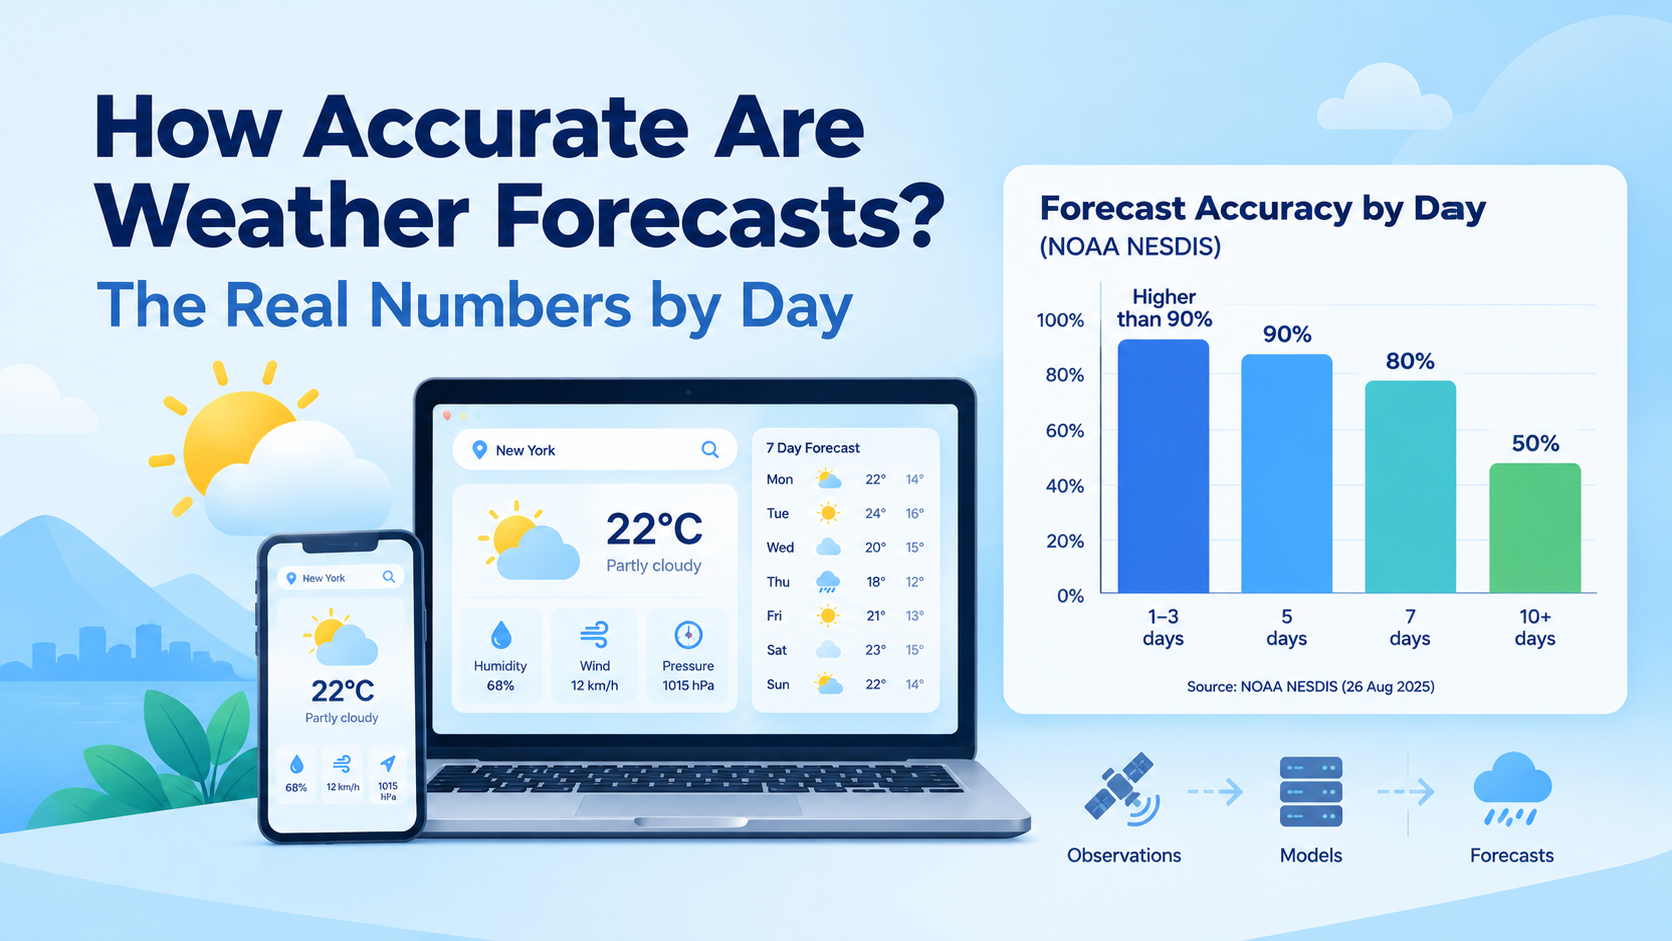
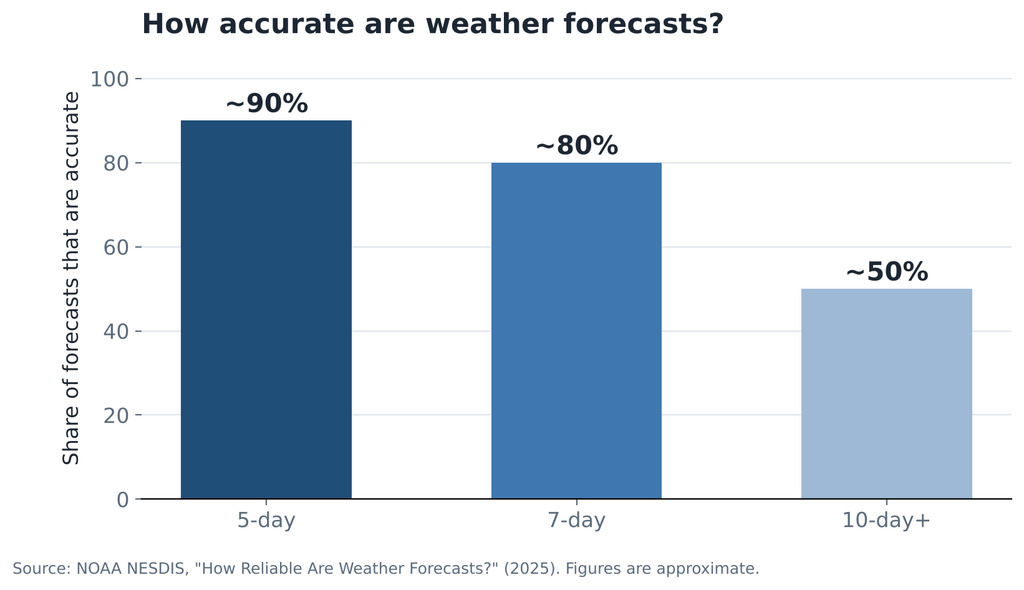
| According to NOAA, a 5-day weather forecast is accurate about 90% of the time, a 7-day forecast about 80% of the time, and a 10-day or longer forecast only about half the time. Forecasts for the next one to three days are the most reliable, and skill for specific daily weather fades out at around two weeks. |
Table of Contents
Key Takeaways
- NOAA puts 5-day forecasts at about 90% accuracy, 7-day at about 80%, and 10-day or longer at about 50%.
- Forecasts keep improving. Skill for 3 to 10 days ahead has grown by roughly one day per decade, so today’s 6-day forecast is about as good as a 5-day forecast was ten years ago.
- ECMWF’s global model has long led NOAA’s GFS on standard verification scores, and AI-based models now match or beat both on many measures.
- Temperature is the easiest variable to forecast and precipitation the hardest, especially the exact timing and location of showers and storms.
- If you build with weather data, short horizons and frequent updates matter more than the length of the forecast you display.
Everyone has a story about a forecast that got it wrong. The data tells a different story: modern forecasts are right most of the time for the next week, and they get measurably better every decade. What changes with range is how much you should trust the details. This post gives the real numbers, explains where they come from, and covers which weather model performs best.
The short answer, by forecast range
| Forecast range | How accurate | What to trust | Source |
|---|---|---|---|
| 1 to 3 days | The most accurate range; higher than the 5-day figure | Timing of fronts, highs and lows, whether it will rain | NOAA (implied by the 5-day figure); see NOAA NESDIS |
| 5 days | About 90% | General pattern and temperatures | NOAA NESDIS |
| 7 days | About 80% | Broad trends: warmer, cooler, unsettled | NOAA NESDIS |
| 10 days | About 50% | Very little day-specific detail | NOAA NESDIS (“10-day or longer”) |
| 14 days and beyond | No useful day-specific skill; probabilistic outlooks only | Odds of above or below normal temperature and precipitation | NOAA CPC 8–14 day outlooks; Zhang et al., 2019 |
“Accurate” in NOAA’s figures means the forecast was right about the weather that happened, not that every number matched to the degree. A forecast high of 21°C that arrives as 22°C counts as a good forecast.
It also helps to separate two questions people blur together. One is whether the forecast called the pattern correctly: a cold front on Thursday, a dry weekend, a warm spell next week. The other is whether it nailed the specifics for one point on the map at one hour. Medium-range forecasts are strong on the first question well before they are strong on the second. When a 7-day forecast “busts”, it is usually the timing or the local detail that slipped, while the broad pattern held.
The trend is the encouraging part. A 2015 review in Nature by Bauer, Thorpe and Brunet found that forecast skill from 3 to 10 days ahead has improved by about one day per decade. A 6-day forecast today is roughly as skillful as a 5-day forecast was ten years earlier.
How forecasts are made
Every forecast follows the same three steps.
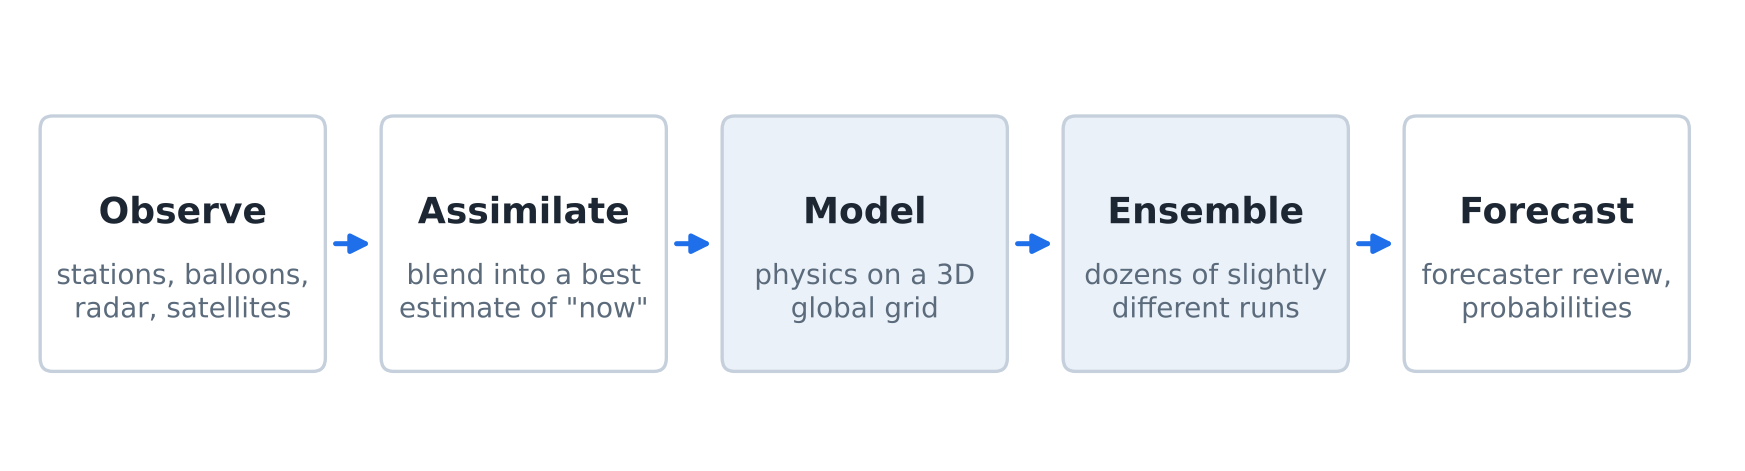
1. Observe. Weather stations, ocean buoys, aircraft, weather balloons, radar and satellites measure the current state of the atmosphere. Satellites matter most over oceans and remote land, where there are few ground stations.
2. Model. Supercomputers run numerical weather prediction models, which solve the physics equations for air movement, heat and moisture on a 3D grid covering the planet. Data assimilation blends the observations into a best estimate of “now” before the model steps forward in time.
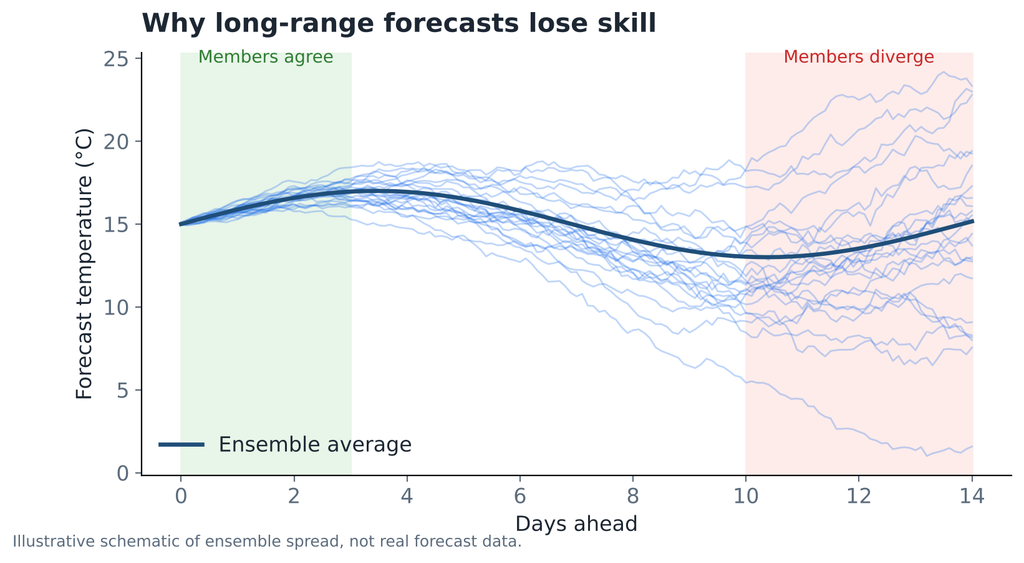
3. Run it many times. Instead of one forecast, centers run an ensemble: dozens of slightly different starting conditions. When the members agree, confidence is high. When they spread apart, the forecast is uncertain. That spread is where probability forecasts such as “40% chance of rain” come from.
Human forecasters then interpret the model output, adjust for local effects, and communicate risk. A probability of precipitation of 40% means a 40% chance that measurable rain falls at any given point in the forecast area, not that it rains for 40% of the day.
Which weather model is most accurate?
The two global models people compare most are:
| ECMWF (IFS) | GFS | |
|---|---|---|
| Run by | European Centre for Medium-Range Weather Forecasts | NOAA’s National Centers for Environmental Prediction |
| Data access | Many products open since 2025; some still licensed | Free and open |
| Standard verification | Has led global verification scores for years | Trails ECMWF on NOAA’s own long-term comparison |
| AI model | AIFS, operational since 25 February 2025 | NOAA has experimental AI versions in development |
In plain English: on the standard headline scores, which measure how well each model forecasts the large-scale pattern of the atmosphere several days ahead, the ECMWF model has been ahead of GFS for most of the past two decades. NOAA publishes this comparison itself, and a 2023 paper in the Bulletin of the American Meteorological Society by Mass and colleagues examined why US global modelling still trails.
AI models are changing the picture. Google DeepMind’s GraphCast was more accurate than ECMWF’s high-resolution forecast on 90% of 1,380 verification targets in a 2023 Science paper. ECMWF’s own AIFS, which went operational in February 2025, outperforms physics-based models on many measures, including gains of up to 20% for tropical cyclone tracks.
Two caveats. Headline scores average over the whole globe, so a model that wins overall can lose on a particular storm or region. And the forecast you see on an app is usually a blend of several models plus local corrections, not one raw model.
Why accuracy collapses after a week
The atmosphere is chaotic. Tiny errors in the starting conditions, from gaps between stations to the limits of every instrument, grow exponentially as the model steps forward. Edward Lorenz identified this in the 1960s, and it means there is a hard ceiling on how far ahead daily weather can be predicted, no matter how good the models get. A 2019 study by Zhang and colleagues estimated that practical limit for mid-latitude weather at about two weeks. Beyond that, forecasters switch from “what will happen on Tuesday” to “will the week be warmer than normal”, which is the kind of outlook NOAA’s Climate Prediction Center publishes.
Accuracy by variable
Not every part of a forecast is equally reliable:
| Variable | Relative skill | Why |
|---|---|---|
| Temperature | Highest | Driven by large-scale air masses that models capture well |
| Wind | Medium | Good on the large scale, but local terrain, buildings and gusts are hard to resolve |
| Cloud cover | Medium | Low cloud and fog depend on small-scale moisture details |
| Precipitation | Lowest | Whether rain falls is easier than exactly when, where and how much, especially for thunderstorms |
That is why a 7-day temperature trend is often useful while a 7-day “rain at 3 pm” is not. Summer convective showers are the hardest case of all: a model can be right that storms will form in your region and still miss your town.
Location matters as well. Forecasts tend to be harder near coastlines, in mountains and around large lakes, where local effects such as sea breezes, valley winds and lake-effect snow play out on scales smaller than a global model’s grid. Regional high-resolution models and local forecaster knowledge exist largely to handle these cases. If your users are concentrated in a tricky climate, check forecasts against local observations before you assume the general accuracy numbers apply to them.
What this means if you build with weather data
If your product uses weather data, the numbers above suggest a few design rules:
- Weight decisions toward short horizons. Use days 1 to 3 for anything operational (staffing, routing, deliveries) and treat days 7 and beyond as trend indicators.
- Refresh often. Forecasts are rerun several times a day. Pulling fresh data before each decision does more for accuracy than displaying a longer range.
- Show uncertainty. Displaying a precipitation probability or a temperature range is more honest, and more useful, than a single number for day 9.
- Check against what happened. Store forecasts and compare them with observed conditions for your locations. That gives you your own verification numbers instead of relying on general ones.
Weatherstack provides current conditions, forecasts up to 14 days (depending on plan) and historical data through one API. The forecast API guide covers integrating forecasts into an app, and our guide to historical weather data explains how to get past observations, which is what you need to verify forecasts yourself.
FAQs
How accurate is a 7 day forecast?
According to NOAA, a 7-day forecast is accurate about 80% of the time. It is reliable for broad trends such as warmer or wetter than now, and less reliable for exact timing of rain.
How accurate is a 10 day forecast?
NOAA says forecasts of 10 days or longer are right only about half the time. Use them as a rough guide to the overall pattern, not for planning around a specific day.
What is the most accurate weather model?
On standard global verification scores, ECMWF’s model has led NOAA’s GFS for many years. AI models such as ECMWF’s AIFS and Google DeepMind’s GraphCast now match or beat traditional models on many measures.
Why do forecasts keep changing?
Forecast centers rerun their models several times a day with new observations. As the date gets closer, the starting conditions are better known and small errors have less time to grow, so the forecast is updated and becomes more accurate.
| Build on fresh weather data. Get a free Weatherstack API key with 100 requests a month for current conditions, and upgrade when you need forecasts and history. |